


Under Pressure: Can adjusting ball pressure give NBA teams a competitive advantage?
Answer: it's complicated... but, maybe?

“I honestly believe [Bill] Bradley wanted to play pro ball from the beginning -- he loved basketball ... But during a time-out that night, I saw him sneak the ball over to the bench and deflate it just for a second with his pin.”
Marv Albert, I’d Love To But I Have A Game
“[Phil] Jackson always tests the poundage in the game balls before the game. The balls that night in Miami were well below the required 7.5 to 8.5 pounds. An innocent oversight? Unlikely. With a softer ball players can't dribble as fast and the game slows. It was what a less talented team like Miami wanted against a running team like the Bulls. Jackson got the balls pumped up and the Heat were deflated.
It works the way other, too; Jackson has caught the Lakers trying to sneak balls with 15 to 17 pounds of air into the game. Why? Magic Johnson likes a high dribble, and a livelier ball results in long rebounds that key the kind of fast break the Lakers love to use, especially at home.”
Sam Smith, The Jordan Rules
A few days ago, I stumbled across Mike Beuoy’s1 2017 article “A Deflategate Analysis for the NBA.”2 Using SportVU tracking data made public by the NBA between 2013 and 2016, Beuoy used a bit of physics know-how, a lot of ball-positioning data, and some linear regression to compute “coefficients of restitution” for each NBA game played during those three seasons (2013-14, 2014-15, and 2015-16), which roughly correspond to ball bounciness — a higher coefficient of restitution means a bouncier ball.
In the spirit of Deflategate — that wonderful months-long FUBAR investigation full of rumors, speculation, and broken cell phones that somehow ended with a four-game suspension for Tom Brady and a $1 million fine for the New England Patriots — Beuoy’s investigation focused on the question “Do teams intentionally over- or under-inflate their home basketballs?”
This idea is nothing new to the NBA. As illustrated by the excerpts from Sam Smith and Marv Albert’s writing3, coaches and players alike have long been aware of the benefits and drawbacks of an over- or under-inflated basketball. Over-inflated balls mean a faster pace, a higher handle, and more bricks. As Nets forward Scott Padgett said of the Utah Jazz when he accused them of overinflating their balls: “They have an offense geared toward the layup, so they want your jumpers bouncing out.”4 Under-inflated balls, on the other hand, tend to bounce lower, slow the game down, and most importantly have a softer touch on the rim, leading to higher field goal percentages.
Ultimately, Beuoy drew the following conclusion regarding whether or not teams are juicing their home-arena balls:
I think it is highly likely some NBA teams deliberately and consistently inflate balls to one end of the allowed psi range to better suit their playing style. While not the makings of a juicy scandal, I think this is an interesting result nonetheless, and would love to hear from those in the know whether my team by team analysis has any validity.
I consider this post a follow-up on Beuoy’s analysis back in 2017, using the data he provided in an appendix to his post, which included the average coefficients of restitution for each team in each season of the three-season sample.
While his analysis primarily focused on whether or not teams were deliberately inflating or deflating their balls, I want to look at the impacts of ball pressure on game play, specifically shooting ability. We’ll do this by looking at two measures of shooting ability: free-throw percentage and three-point percentage.
Ball Pressure and Free Throw Percentage
In his original post, Beuoy did briefly address this. Using methodology from one of his previous analyses5, he calculated an expected free-throw percentage for each away-team player and then compared it to the actual free-throw percentage for that player in the game. He computed this data for every game, grouped it by home team and season, and then built a linear regression model using average coefficient of restitution to predict his free-throw-percentage-over-expected stat.
If you want to view his charts, they’re in the original article (see footnote 2). Beuoy ultimately concludes this: “Even at this level, we still fall short of standard statistical significance, but the fit does improve, and continues to point in the right direction [note: the “right direction” is bouncier ball = lower FT%]. There is now just a 15% chance that free throw success rate is not correlated with the coefficient of restitution.”
I presume Beuoy’s linear regression model ended up having a p-value around 0.15, given what he says about there still being a 15% chance of no correlation.
After scraping game logs from the three-season sample using nbastatR, I performed a similar analysis on the correlation between free-throw percentages and ball pressure. The main difference between Beuoy’s work and mine is that I used raw free-throw shooting data, not FT% versus expected, to build my dataset.
To do this, I filtered the dataset to include only away games, and then grouped them by opponent, which allowed me to get data for every road team (and just the road team’s) performance in each NBA home arena. I then summed all the free-throw makes and free-throw attempts in each arena, and used that to compute a free-throw percentage. Here’s what the dataset looked like:

I did this for each of the three seasons in Beuoy’s ball pressure dataset, and combined his data on home team ball pressure with my data on opponent free throw percentage in each home arena.
Here are the results for each season, followed by the overall results from combining all three seasons together:

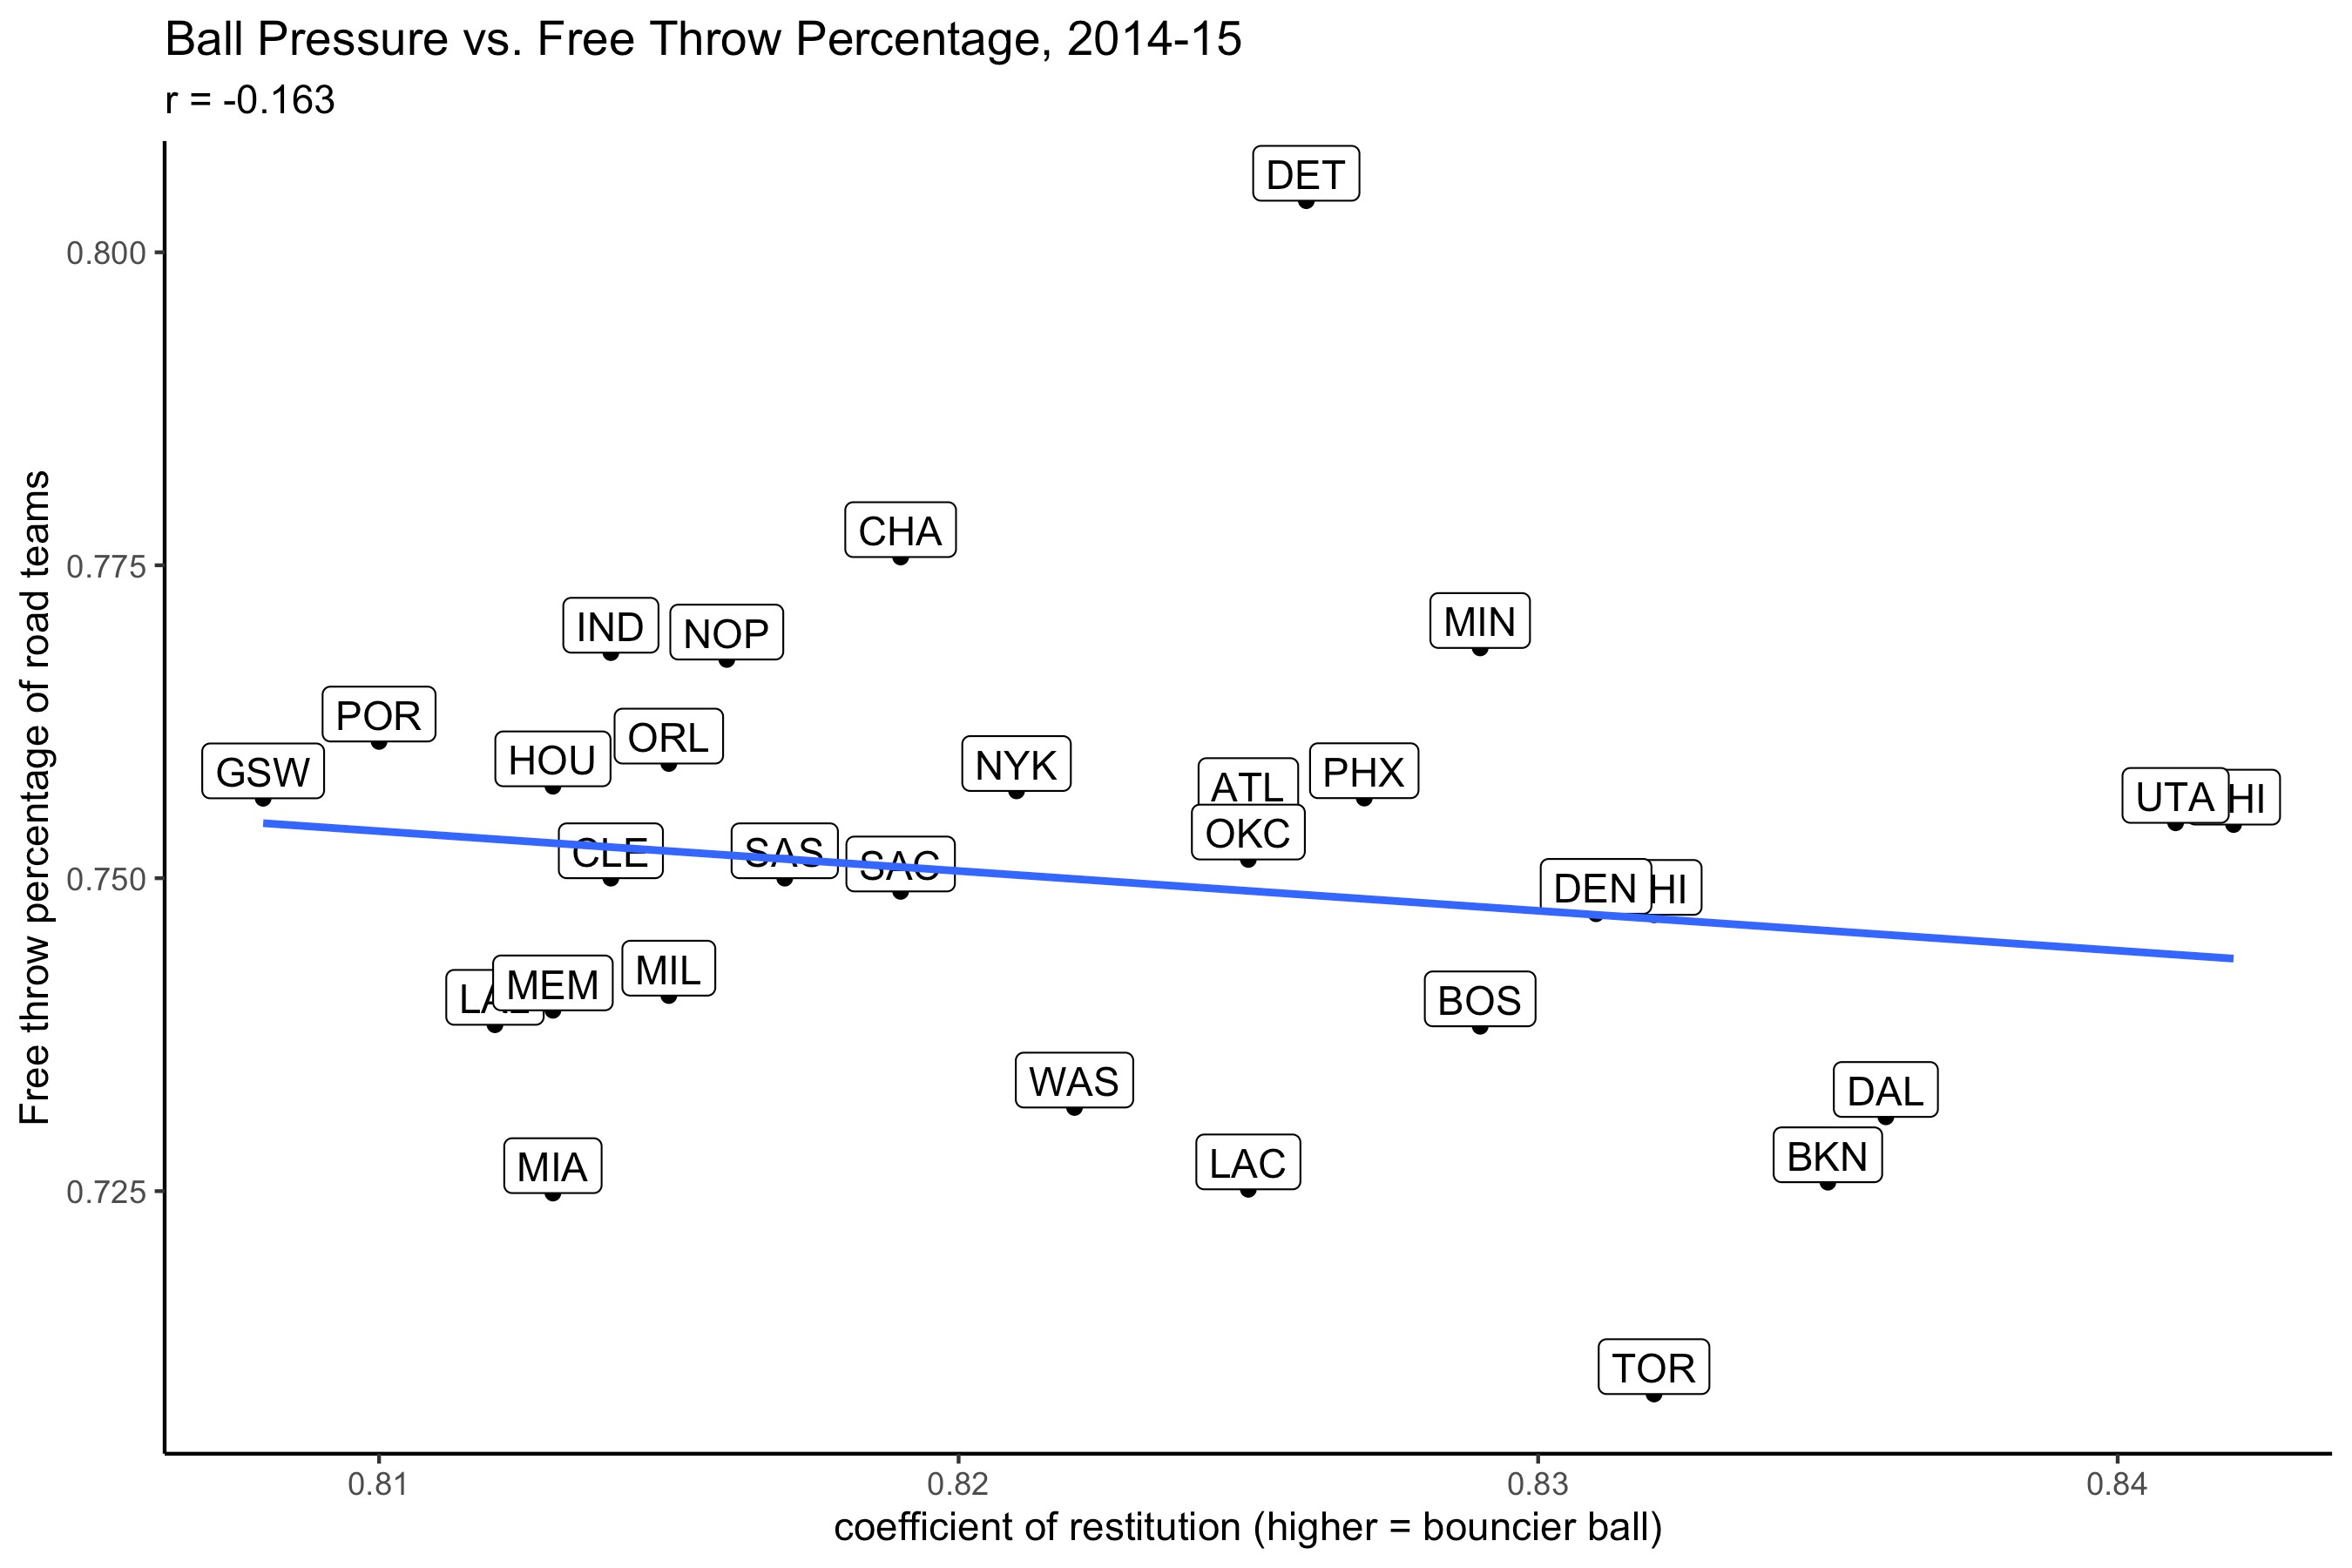
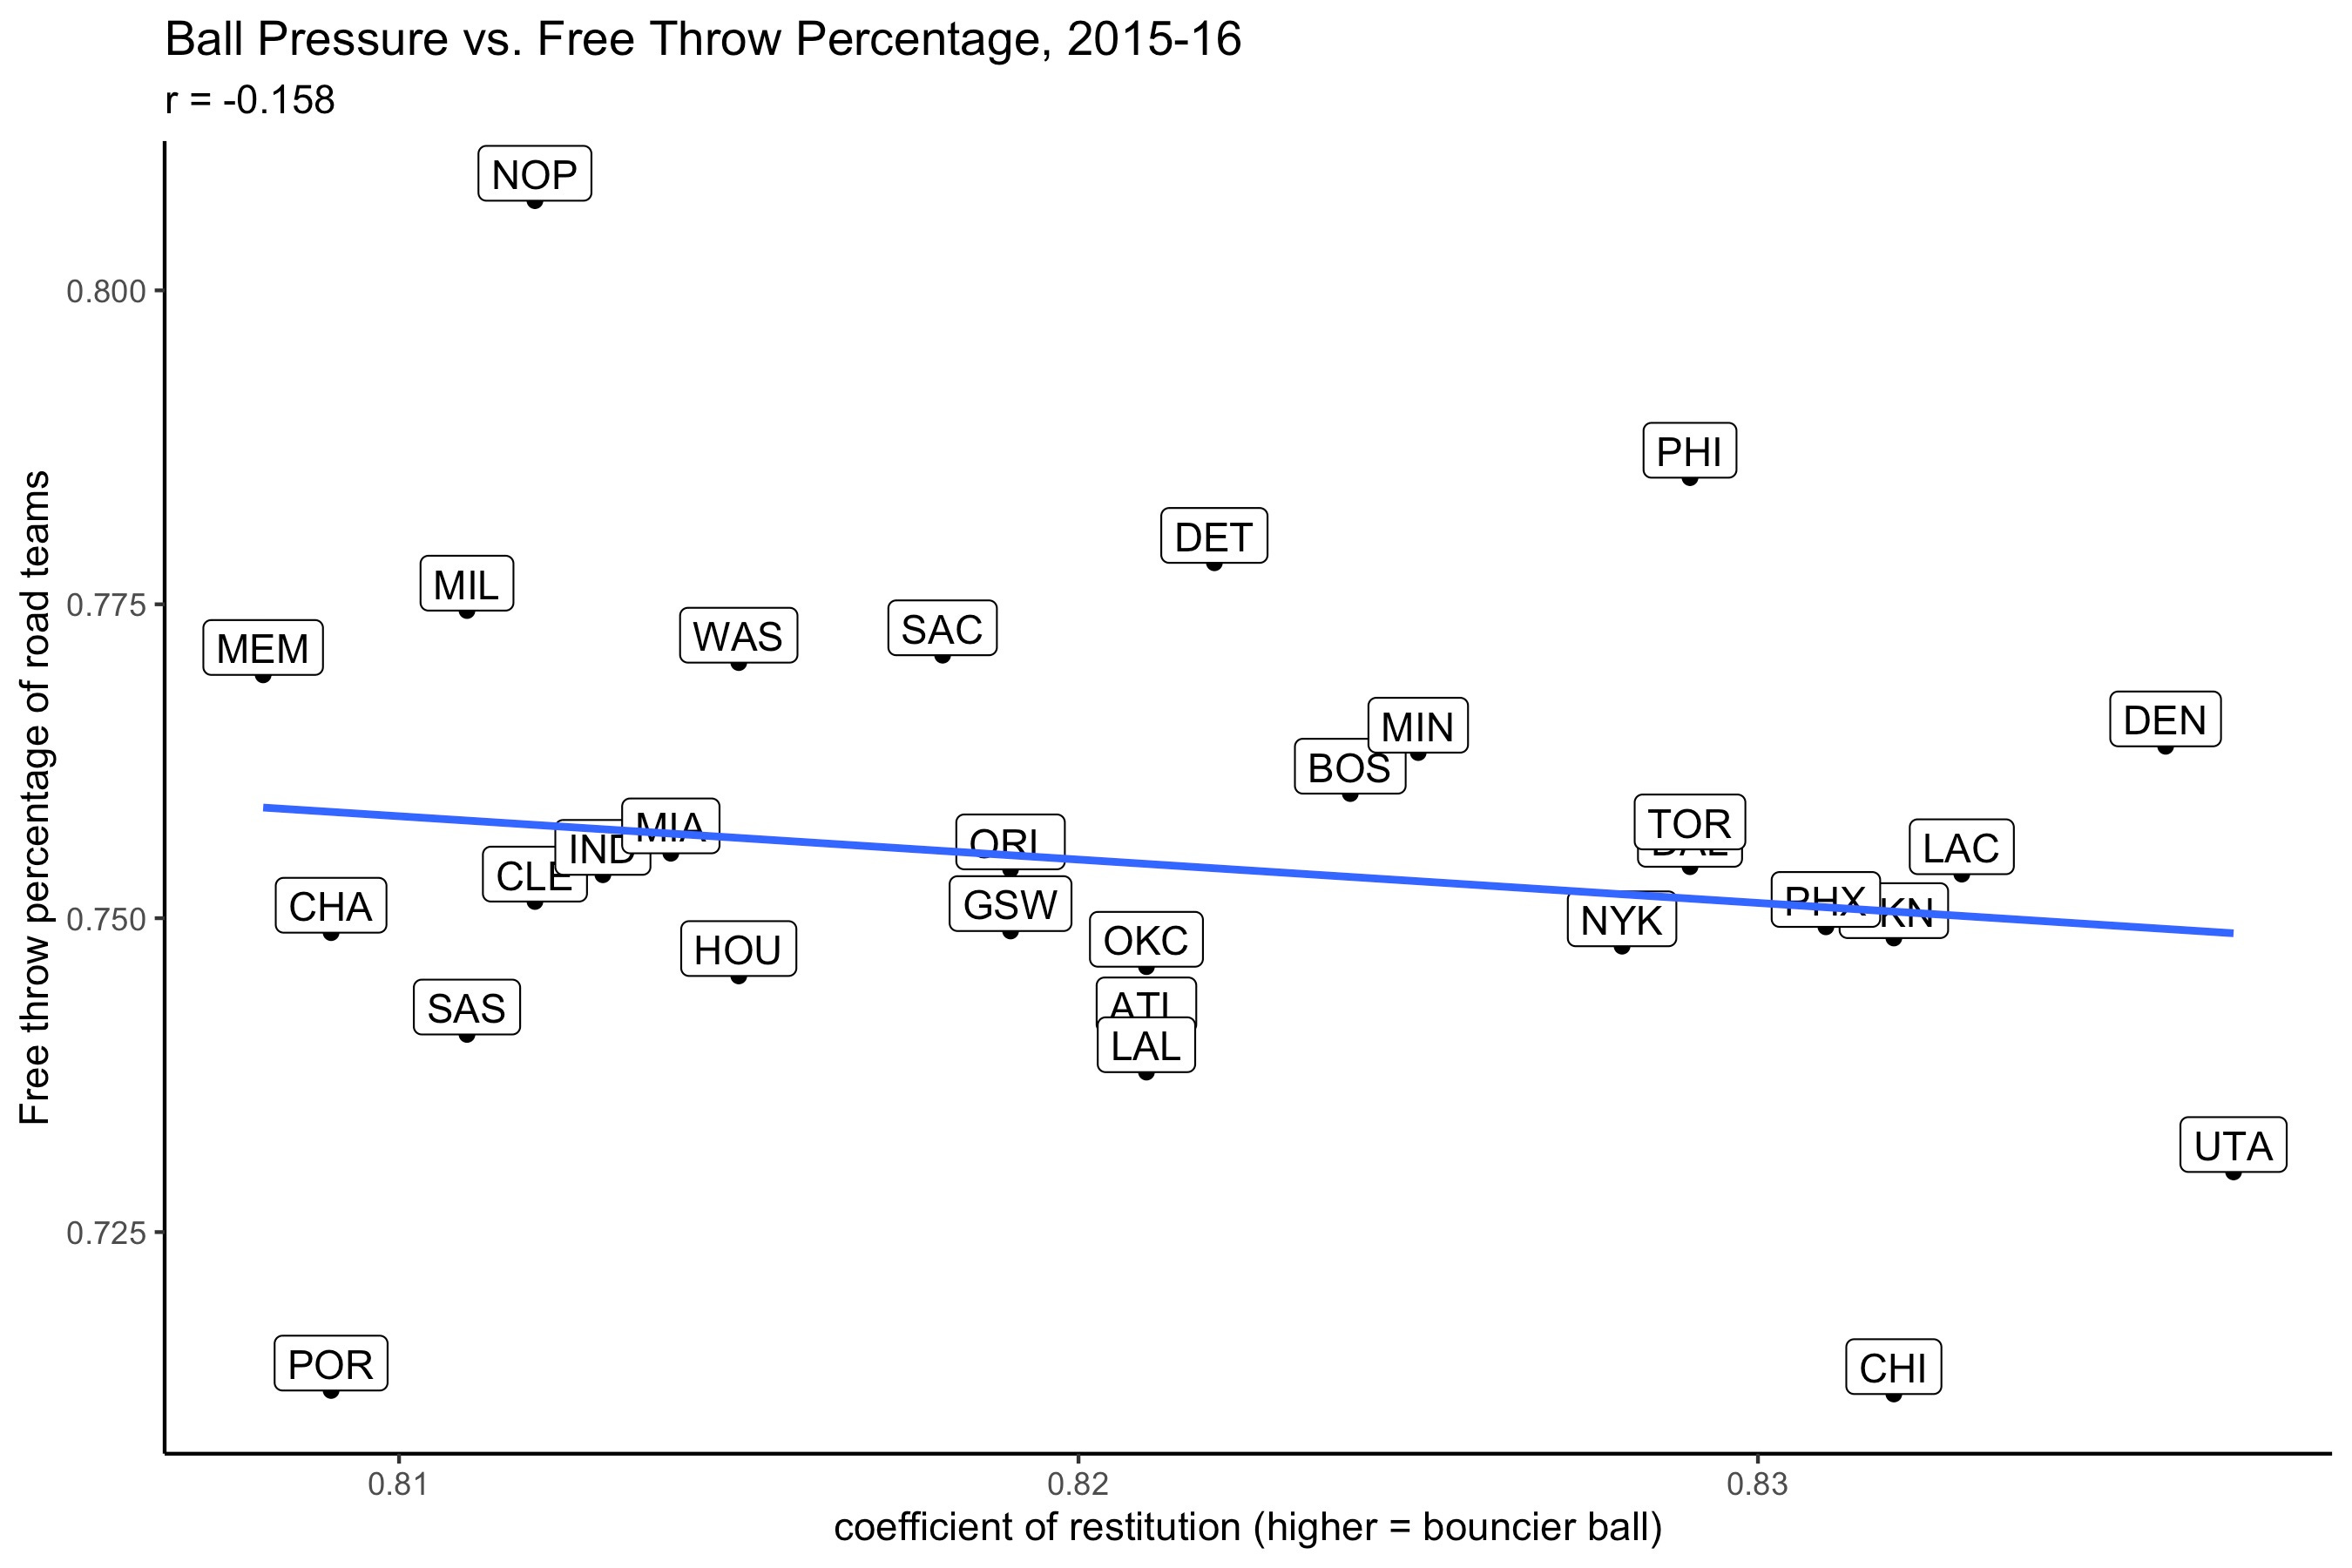
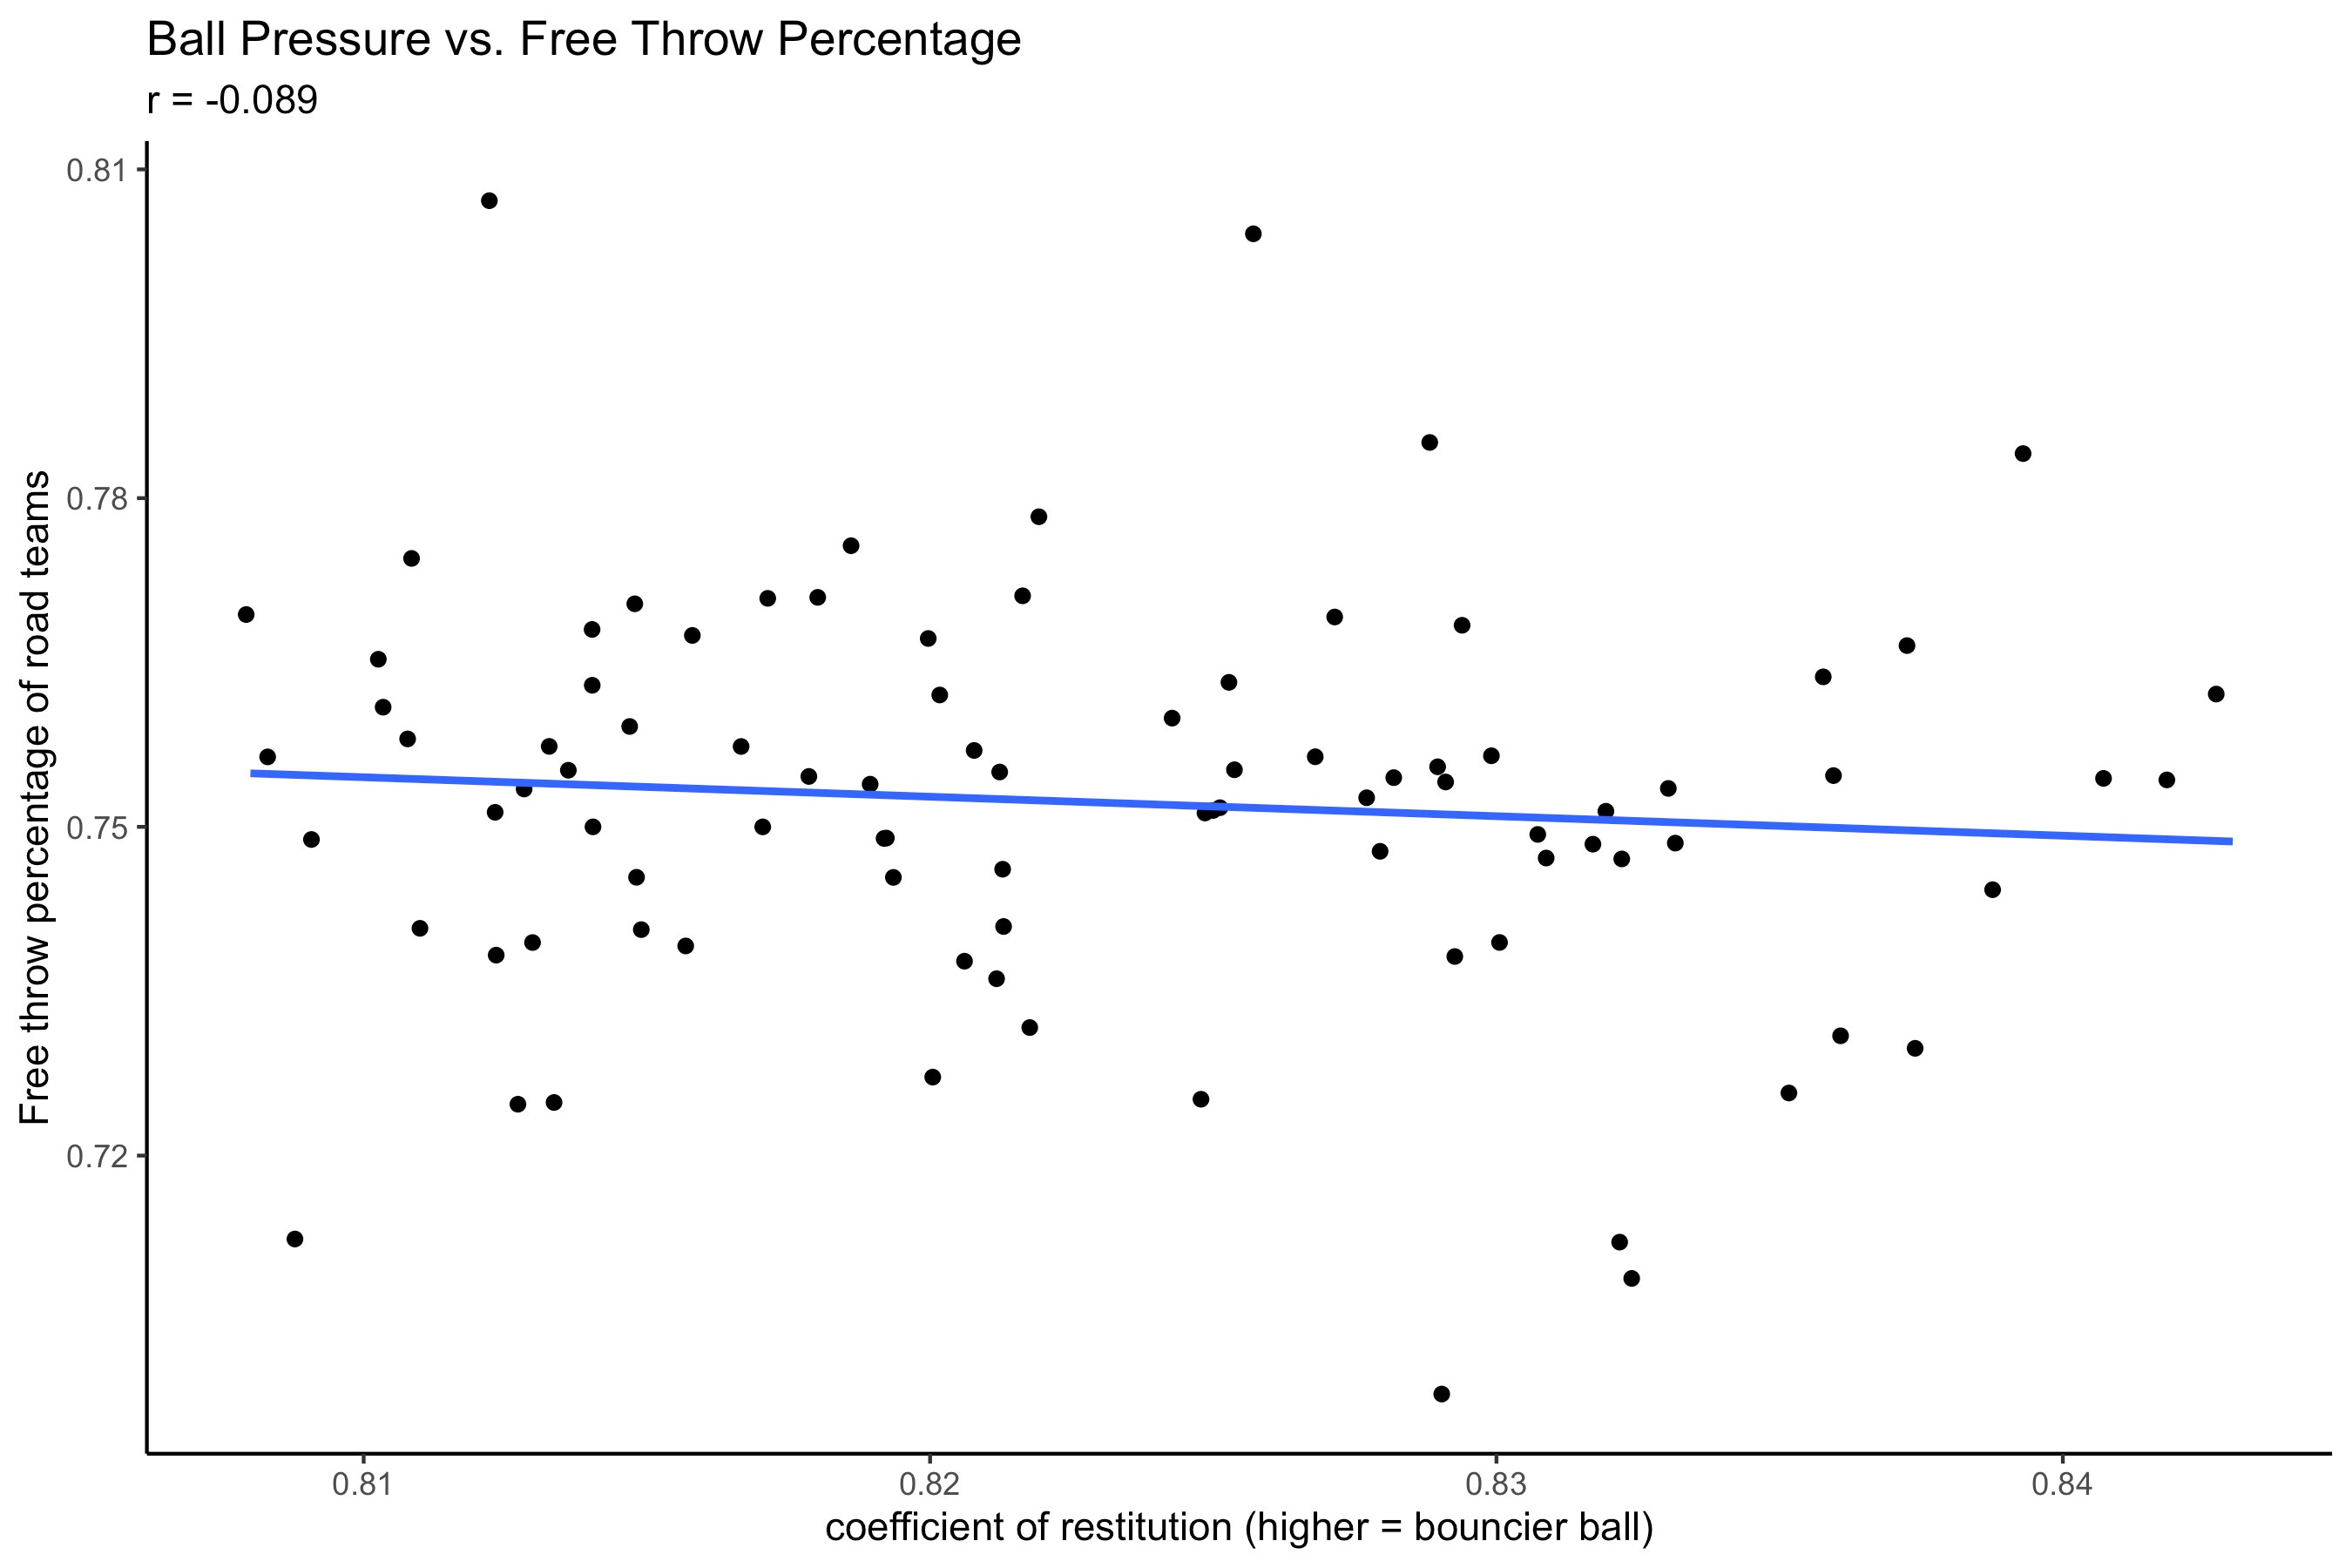
I also found a slight negative overall correlation between the coefficient of restitution and opponent free-throw percentage. However, the results of my analysis were even less significant than Beuoy’s: my p-value came out to be 0.403 — in other words, there’s a 40.3% chance that the trend I noticed was just due to random noise. Very anticlimactic.
Then, I looked at three-point percentage. And that’s where things got interesting.
Ball Pressure and Three Point Percentage
Now, we’re in uncharted territory — like most NBA players, coaches, and anyone who’s ever picked up a basketball, the original post simply assumed that as ball pressure decreased, three-point percentage would increase. When Beuoy noted that the Houston Rockets and GM Daryl Morey tended to use game balls on the lower end of the pressure spectrum, he speculated that it would be a boon to offenses reliant on free throws and three pointers. And no offense ever relied on the three-ball and free throws more than those prime Harden Rockets teams.
However, there was no statistical evidence for this conclusion that softer balls equaled more made threes, though it’s a heuristic that makes a lot of physical sense. Anyone who’s played basketball has seen a slightly-deflated ball take an uncannily generous roll off the front rim and drop into the basket. But I figured I’d still double-check.
I used the exact same data-manipulation techniques to generate the three-point dataset, except instead of selecting free throws made and free throws attempted for each game, I used three pointers made and three pointers attempted. I ended up, just like last time, with compiled data on road team performance sorted by home team arena. (Note: I just realized I hadn’t addressed this yet, but the reason both Beuoy and I used just away-team data is because home-team data wouldn’t be a representative sample. There would be no good way to tease out whether effects at each home arena were due to ball pressure or the home team just being comprised of really good shooters).
Here’s what a sample of the dataset looked like:

I then attached the ball pressure dataset to this one and modeled the results. What I saw really surprised me.

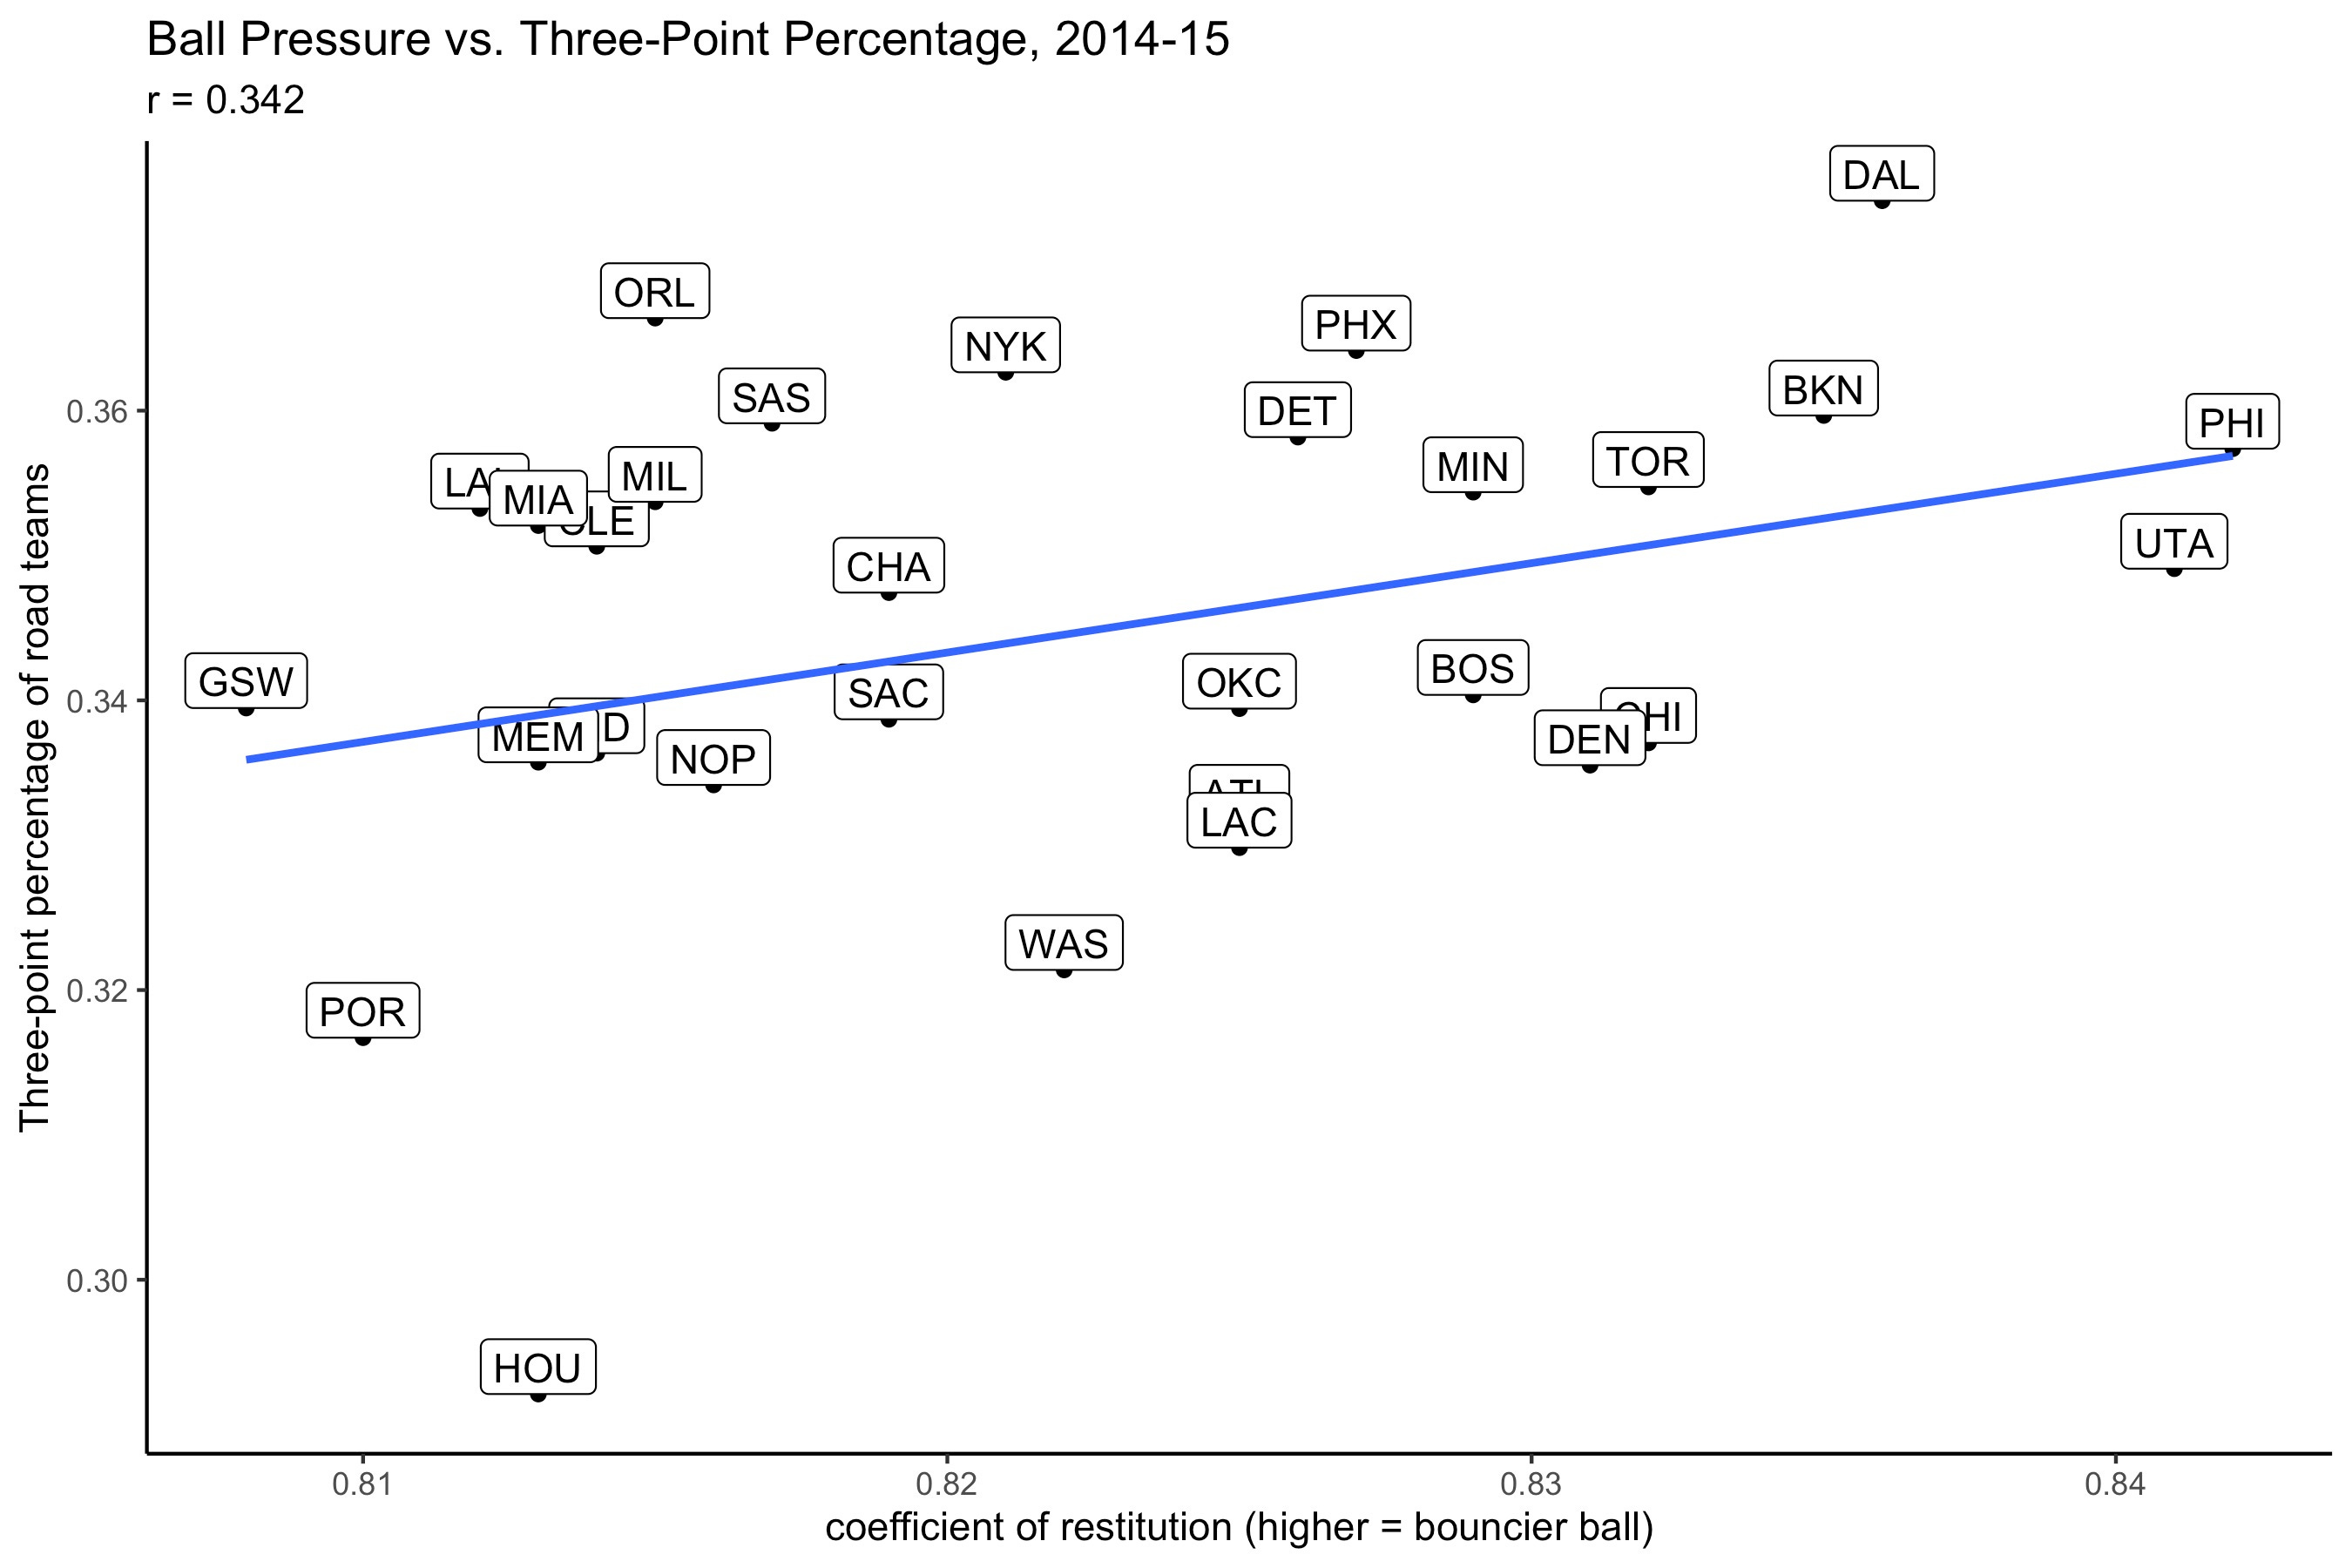

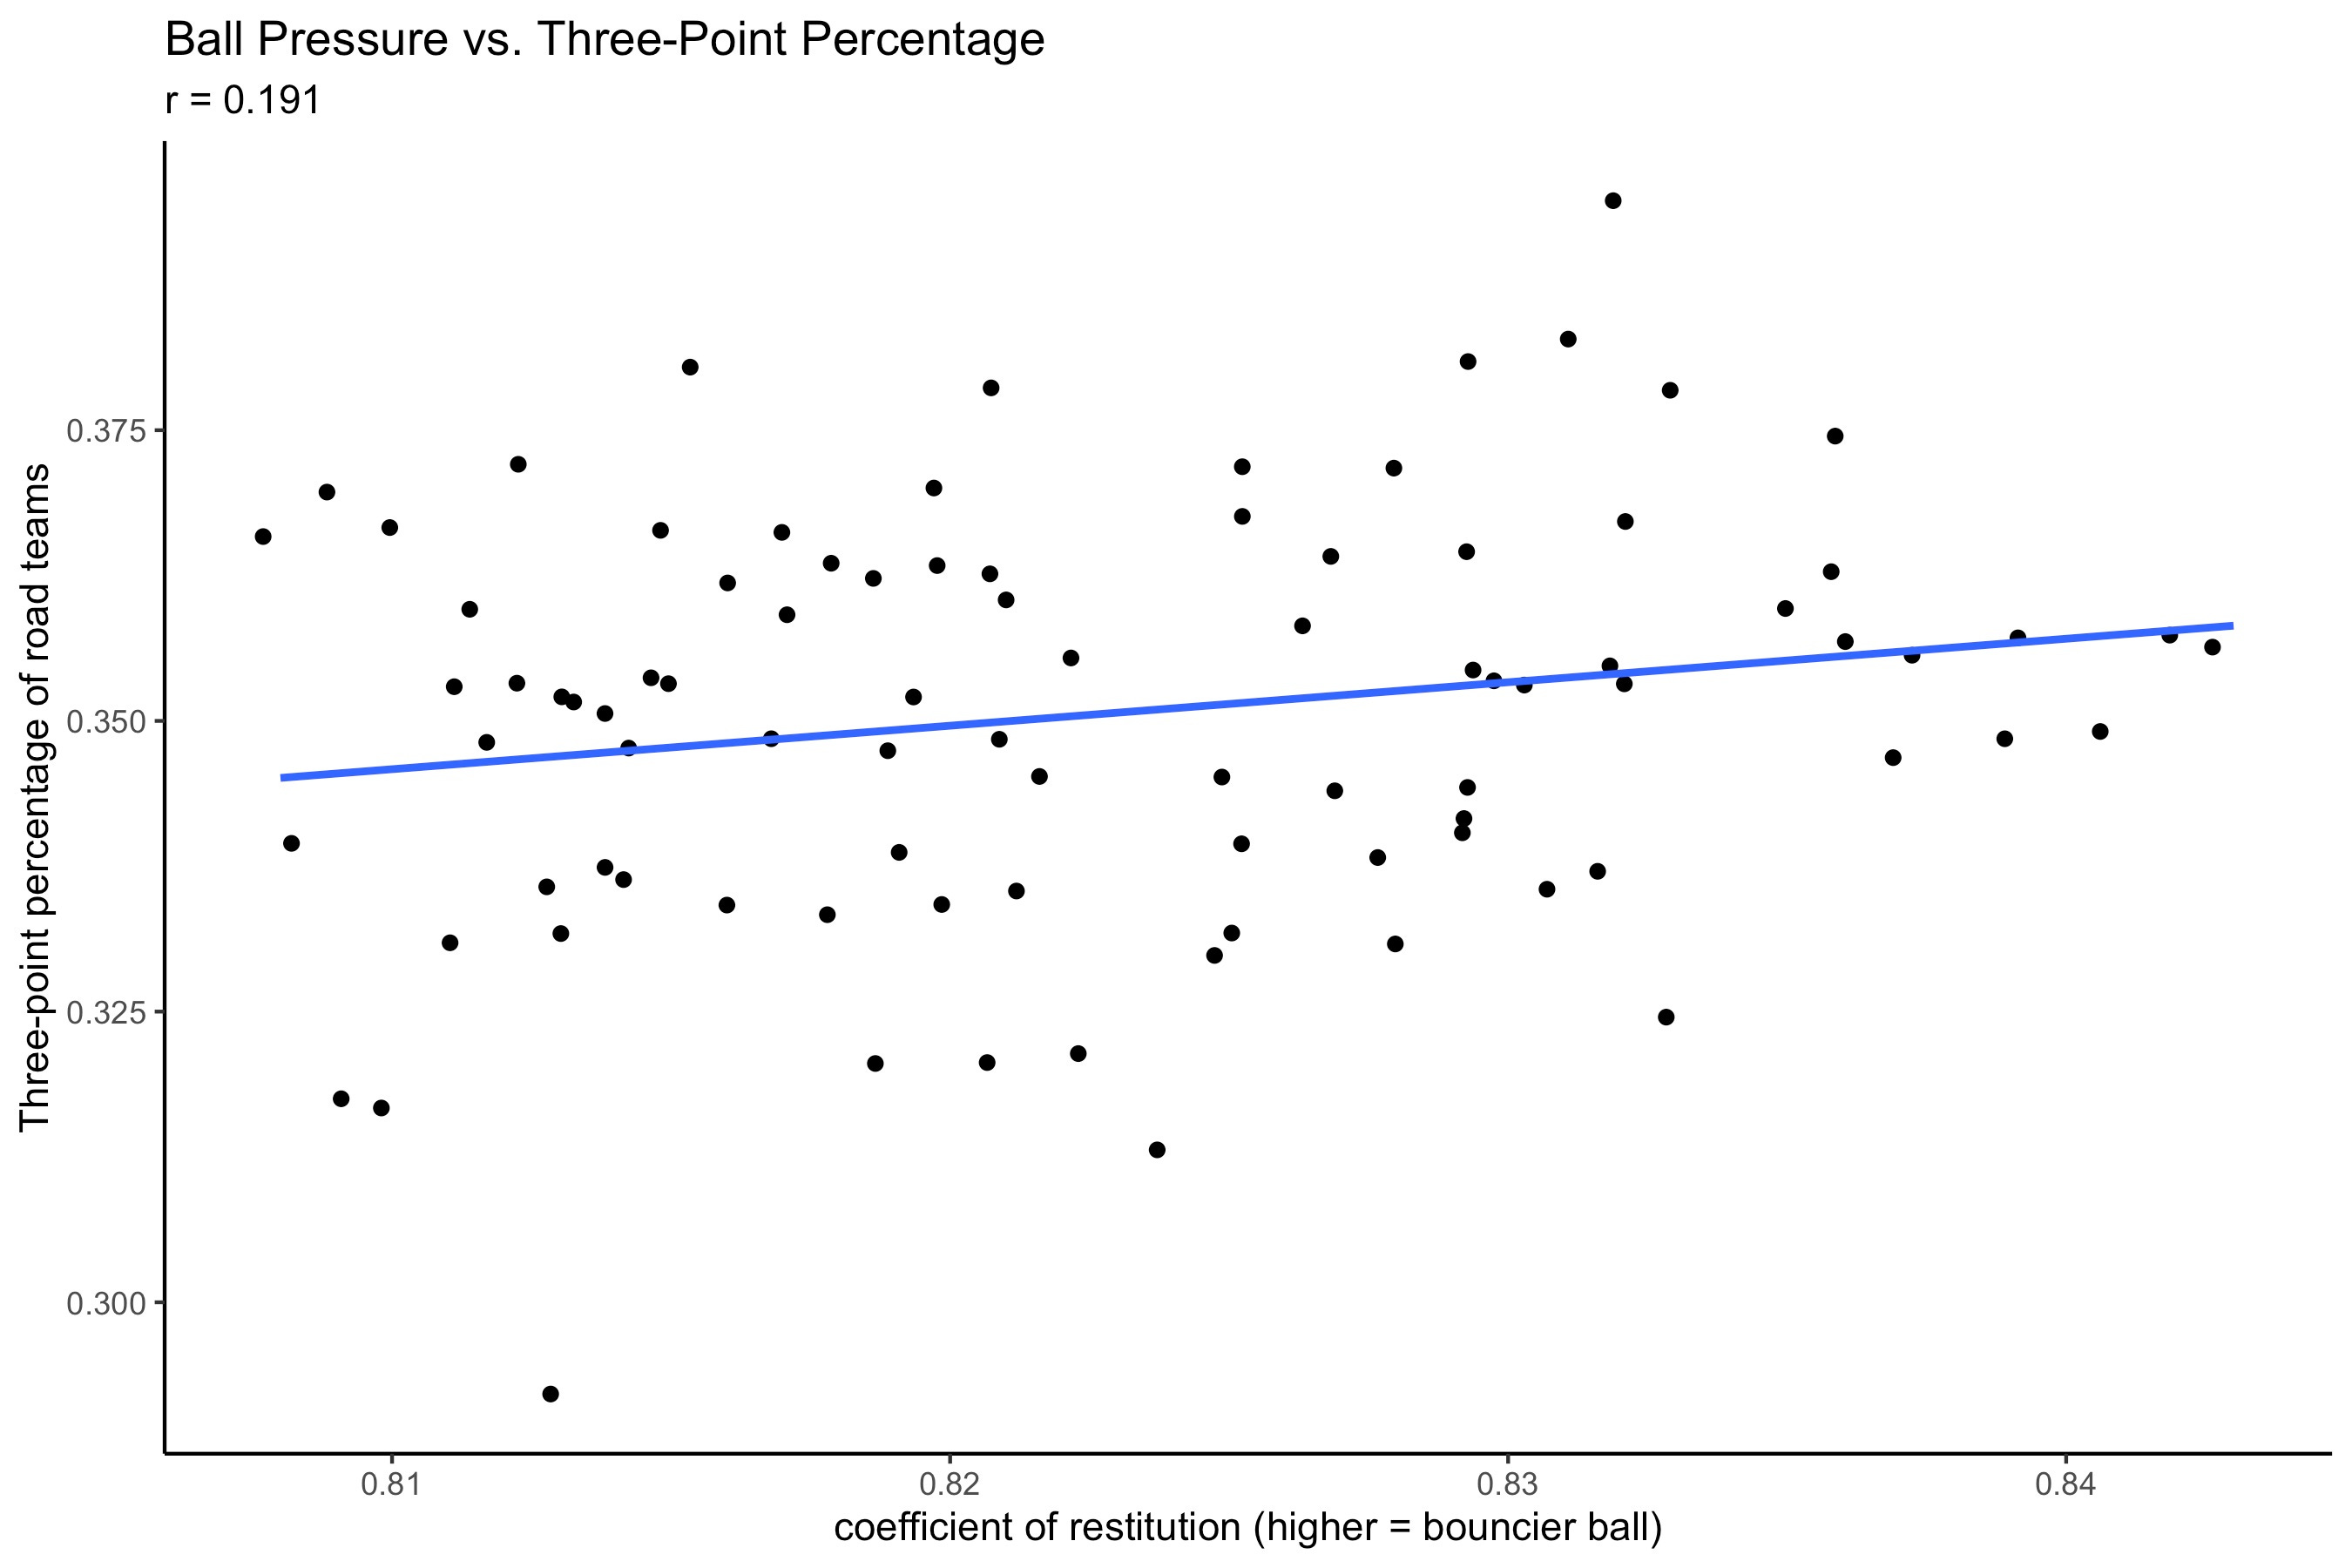
For all three seasons, the three-point percentage of opponents actually increased, on average, as the ball became more inflated! This was the exact opposite of what I’d been expecting, and not only did a positive correlation exist, it actually existed at a greater significance level than either Beuoy’s free throw analysis or my free throw analysis. The overall linear regression model had a p-value of just p = .071 — still not robust enough to indicate significance at the traditional p = .05, but indicating that there was just a 7.1% chance of observing this distribution if the data truly were uncorrelated.
Looking at the scatter plot, I thought there was a chance that the Houston 2014-15 data point was enough of an outlier that it had just totally skewed the model. So I removed it and performed the regression again. However, even this data still had a p-value of just .13, indicating just a 13% chance of seeing these pairings from two truly uncorrelated variables.
However, I’m still hesitant to tell the Timberwolves, Jazz, Bucks, and Warriors (the four teams in the NBA with the highest three-point volume per game)6 to start pumping their balls up to 8.5 psi, the NBA’s maximum permitted ball pressure. The data disagrees with both physics and common sense in arguing that an overinflated ball is easier to shoot from three.
The best answer I’ve been able to come up with to explain this counterintuitive conclusion is this: the bouncier ball does lead to more long rebounds and more fastbreaks, which generate on average higher-quality three point looks, which leads to higher three-point percentages. However, this is totally a hunch and has no data to back it up. I’d love to hear some competing theories on why we observe this trend, which runs counter to decades of conventional wisdom.
Conclusions
An analysis of SportVu tracking data from the 2013-14, 2014-15, and 2015-16 seasons reveals a negative correlation between NBA ball pressure and free throw percentage and a positive correlation between NBA ball pressure and three-point percentage, though none of the linear regression model results were significant at the scientifically-accepted p = 0.05 threshold. My analysis of the correlation between NBA ball pressure in home arenas and raw free throw percentages of road teams found a slight negative correlation at p = 0.403, while Beuoy’s analysis in 2017 which used his own FT% vs. expected FT% data found a slight negative correlation at p ≈ 0.15. My analysis of the correlation between NBA ball pressure in home arenas and raw three point percentages of road teams found a slight positive correlation at p = .071, and after removing a significant outlier from the dataset, p = .130.
In other words: while the data is not by any means definitive, putting a little bit of extra air in the basketball seems to slightly improve three-point shooting percentages while slightly worsening free throw shooting percentages.
Future Analysis
There are two major ways to build on these results in the future.
First: expand the dataset of SportVu observations beyond the three-season sample we currently have. The NBA stopped making these data publicly available in the 2016-17 season. Having access to them would create a larger sample and allow for more accurate conclusions to be drawn.
Second: perform a further analysis on ball pressure’s correlation with other statistics (e.g. tempo, fast break points, fast break threes) to a) determine other effects of ball pressure on the NBA game and b) test my hypothesis for why higher ball pressure increases three-point percentage.
Beuoy is one of the best sports data analysts out there and a diehard NBA fan. I strongly recommend checking out all of his work over at inpredictable.com or on Twitter, where his handle is @inpredict
https://www.inpredictable.com/2017/01/a-deflategate-analysis-for-nba.html
https://www.sbnation.com/nba/2015/1/28/7929177/deflategate-tom-brady-nba-basketball-phil-jackson
https://www.spurstalk.com/forums/showthread.php?t=33584
https://www.inpredictable.com/2016/02/are-there-shooter-friendly-nba-arenas.html
https://www.basketball-reference.com/leagues/NBA_2022.html