


Introducing my first web app: exploring college performance in the NBA
Click around and explore a bit!

LINK TO APP: https://bbwieland.shinyapps.io/DraftVisualization/
I've always been slightly annoyed with how hard it is to get really basic statistic about college performance in the NBA. Even simple questions like "how many players have been drafted from the University of Virginia since 2000?" take a pretty decent amount of Googling and RealGM navigation to answer, and comparing schools or getting total leaderboards is pretty much impossible.
So, I used data on every NBA draft selection since 1990 along with R Shiny to create a web app that's capable of answering some of these questions more easily. The interface might be a little bit buggy on mobile, especially the graphs, but it should work well on desktop at this point.
Things you can do with the site:
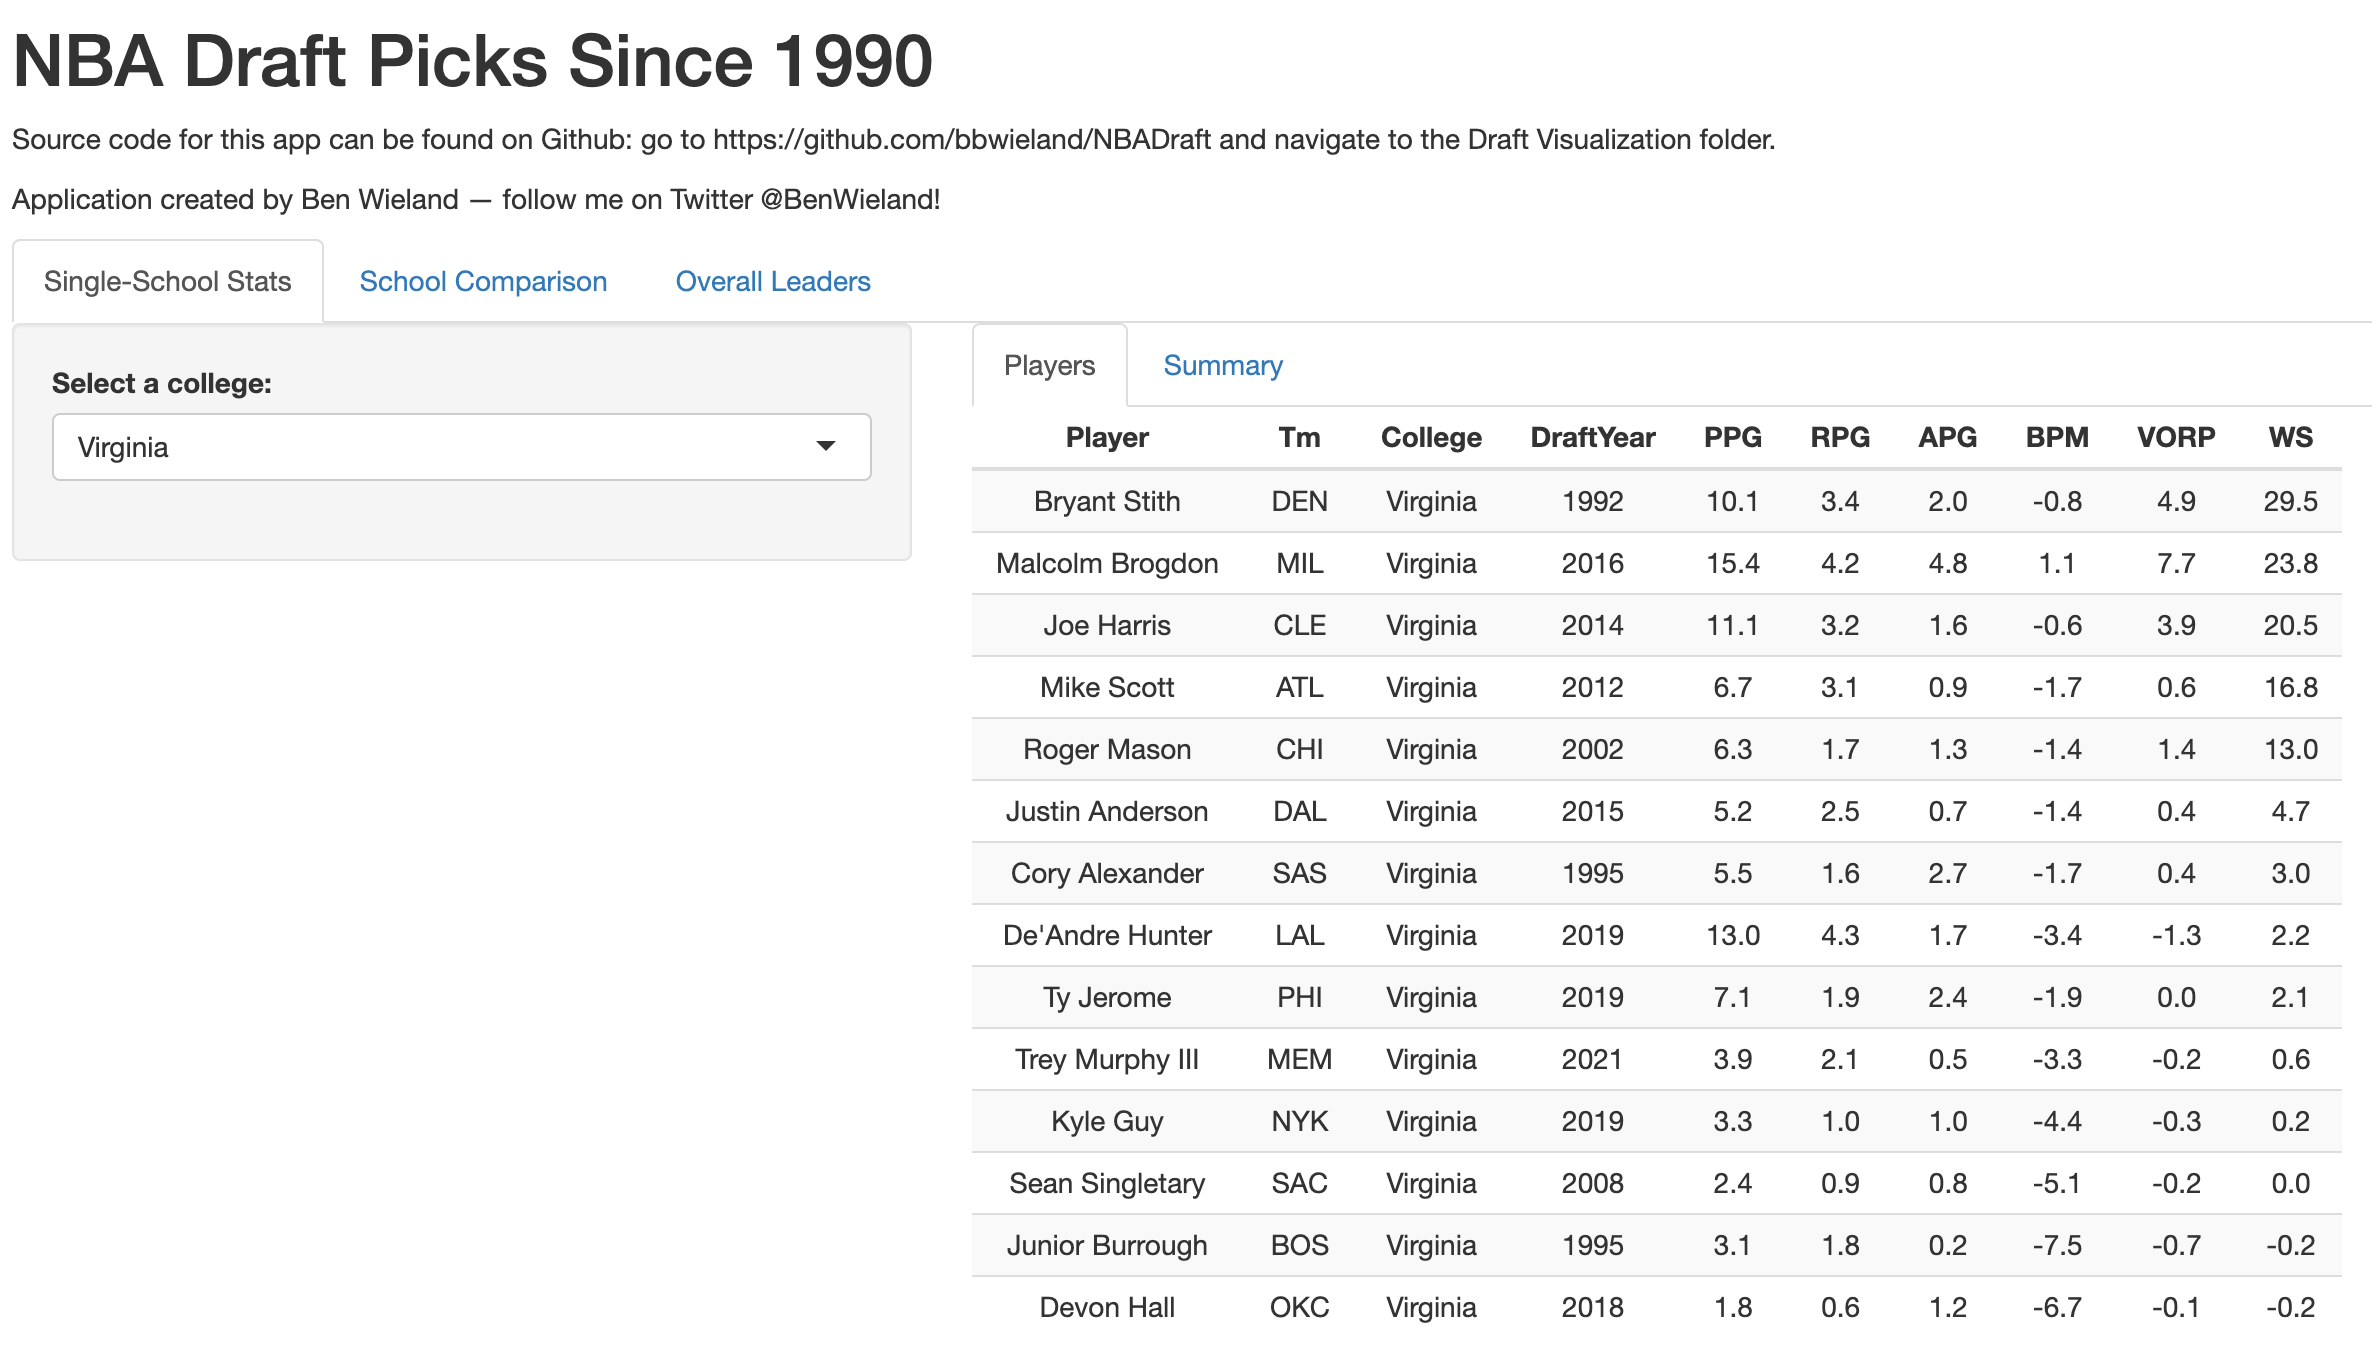
Single-School Statistics:
Select a school, and get a list of all players who were drafted to the NBA from that school since 1990.
View some basic statistics for each player in the NBA: which team drafted them, when they were draft, points/rebounds/assists per game in the NBA, and a few advanced statistics — career box plus-minus (BPM), value over replacement player (VORP), and win shares (WS). Yes, the advanced stats aren't perfect, but they are decent for generally getting an idea of how good a player's NBA career was.
View a summary table for the school, including number of players drafted, number of NBA games played by players from that school, and totals for a variety of other statistics (points, rebounds, assists, win shares, etc.) in the NBA for players from that school.
School Comparison:
Select two schools that you would like to compare.
View summary tables, like those from the single-school statistics page, for each of the two schools you selected.
Select a statistic to compare between the two schools. By navigating to the "Visualize" tab, you should be able to view an automatically-updating bar graph comparing the two schools by that statistic (the default page compares Kansas and Duke by total NBA Win Shares).
Overall Leaders:
Select a statistic that you would like to get a leaderboard for, and choose a number of teams (between 5 and 40) that you would like to display on the leaderboard.
Automatically generate a table ranking the leaders in your selected statistic.
Auto-generate a bar graph displaying the leaders in your chosen statistic.
I've tried to give a pretty basic overview of what the site does, but honestly the easiest way to figure it out is to just explore it yourself.
In the future, I plan to try and expand the data to go back beyond 1990, and also hopefully add a few more features for creating more visually appealing visualizations (things are pretty basic at the moment).
Some sample questions that can be answered by the app:
How many NBA players drafted from Syracuse averaged 10 points per game in their NBA careers (the answer is 4: Carmelo Anthony, Derrick Coleman, Billy Owens, and Jerami Grant)
Which Oklahoma State draftee averages the most career assists per game? (it's Marcus Smart, with 4.3)
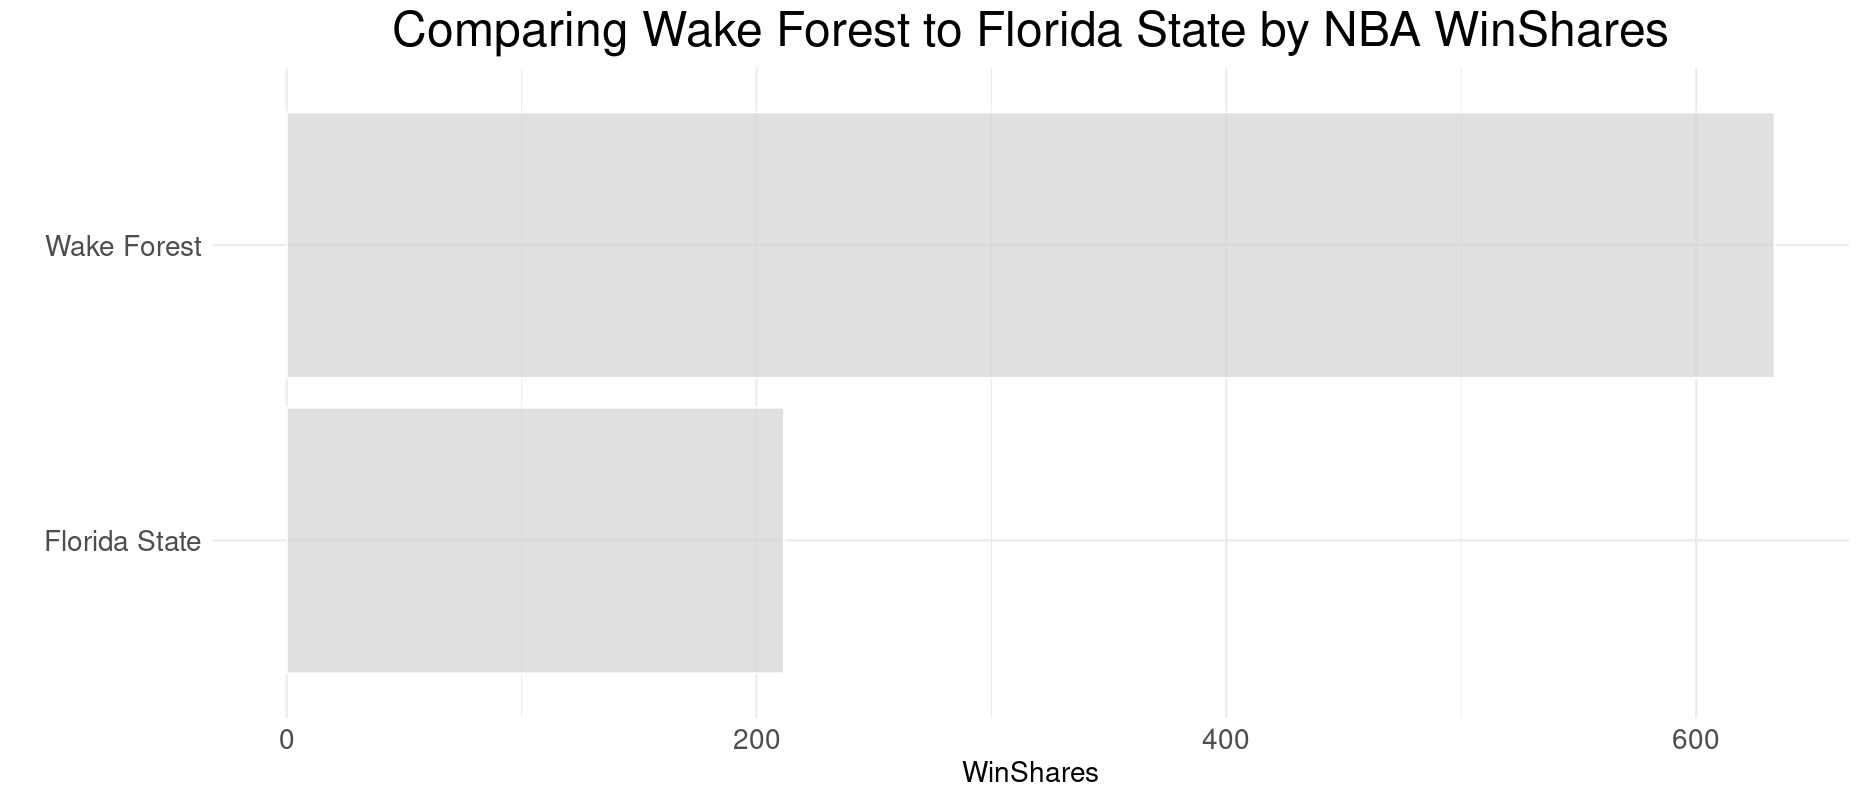
Has Florida State or Wake Forest produced more NBA players? (Florida State has produced 24 draftees, while Wake Forest has produced just 11).
On the other hand... could we make a bar graph to visualize whether Wake Forest or Florida State draftees have played more NBA games? (Wake Forest, thanks to Tim Duncan and Chris Paul, holds a small lead in that department).
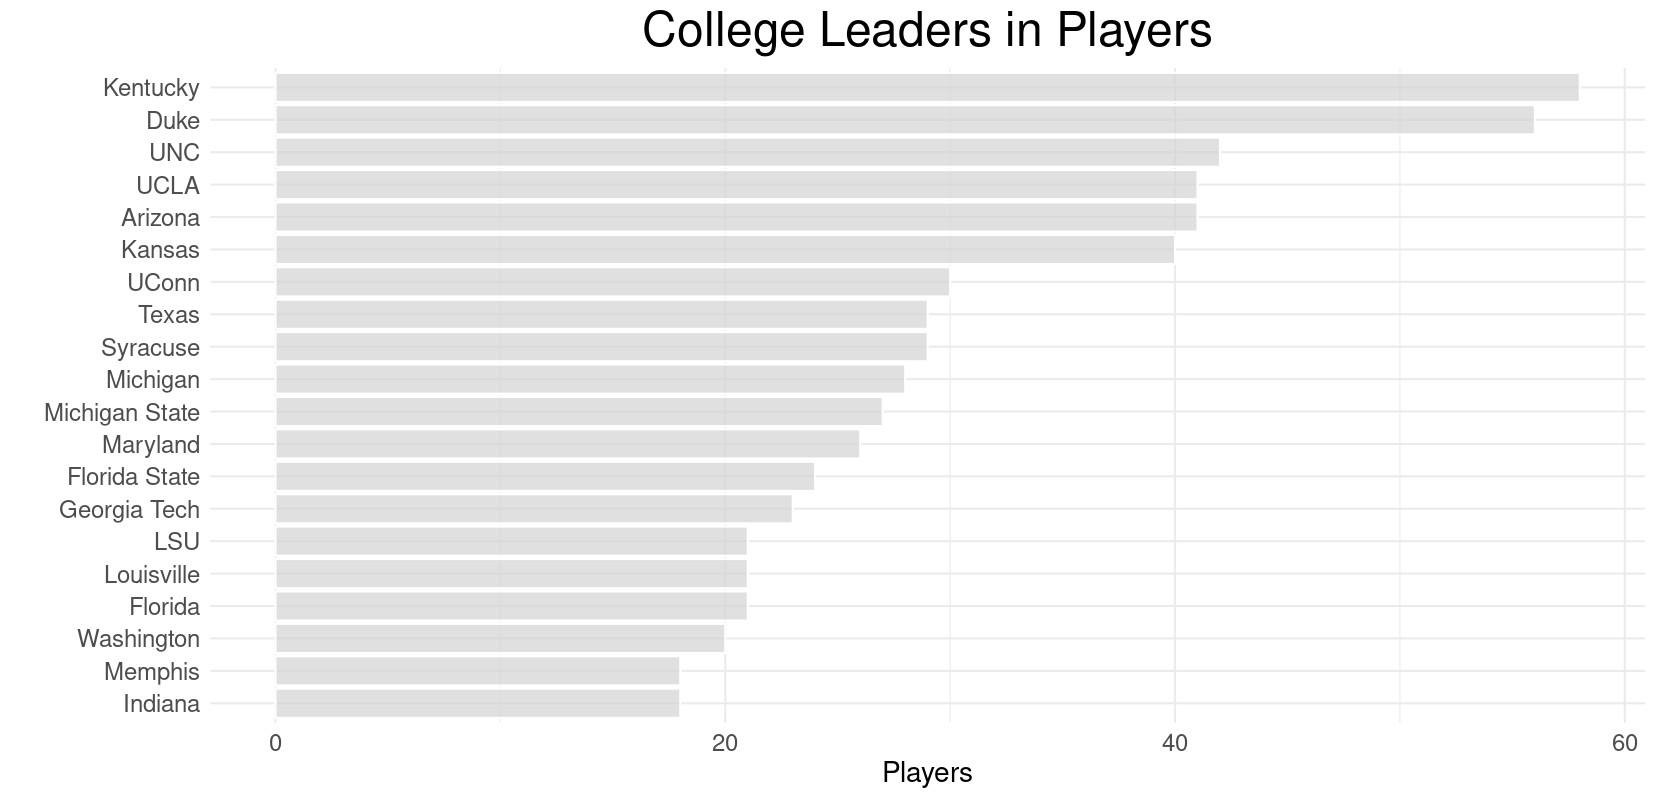
What if we wanted to generate a table of the 20 colleges that have produced the most NBA players?
And what if we wanted to turn that table into a sorted bar graph?
No fancy queries necessary — everything on the page should be navigable by simply selecting some drop-down menu options and dragging a few sliders. The graphs do not currently function very well on mobile, but other than that, everything should be up and running. Check it out!